
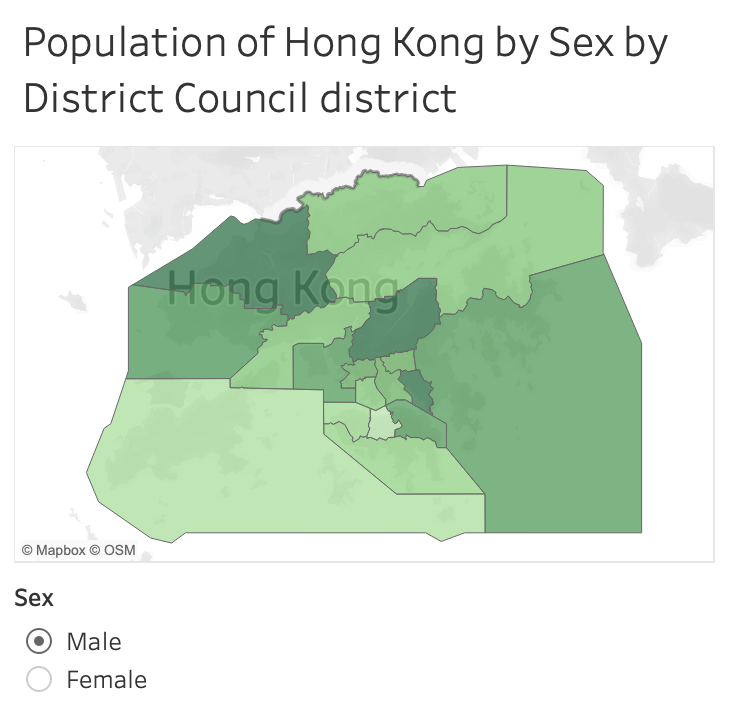
When visualising data on Map, it is useful to flip through views without changing sheets. For example, viewing the population of an area by sex or by age.
Parameters in Tableau can be used to replace a constant value in a calculation or filter. By showing parameter control in the viz, viewers can interact with the visualised data directly.
Sample Data
| Name of District Council district | Male | Female |
|---|---|---|
| Central and Western | 98282 | 137671 |
| Wan Chai | 67075 | 99620 |
| Eastern | 233542 | 296061 |
| Southern | 116238 | 147039 |
| Yau Tsim Mong | 138873 | 171774 |
| Sham Shui Po | 197878 | 233212 |
| Kowloon City | 179518 | 231116 |
| Wong Tai Sin | 187531 | 219271 |
| Kwun Tong | 312303 | 360863 |
| Kwai Tsing | 232213 | 263585 |
| Tsuen Wan | 146412 | 173682 |
| Tuen Mun | 240321 | 266558 |
| Yuen Long | 314056 | 354024 |
| North | 145343 | 164288 |
| Tai Po | 146038 | 170432 |
| Sha Tin | 317927 | 372879 |
| Sai Kung | 223094 | 265943 |
| Islands | 84985 | 100297 |
Step 1: Create a parameter
- In the Data pane, click the drop-down arrow next to “View data” and select Create parameter…

- In the Create Parameter dialog, enter the Name.

- Under Properties, select Integer.

- For “Allowable values”, select List
- Enter the “Value” and “Display As” pair.

- When finshed, click OK.
- The newly created parameter can be found under Parameters at the bottom of Data the pane. Right click on it. Select Show Parameter.

Step 2: Create Calculated Field
- In the Data Pane, click the drop-down arrow next to “View data” and select Create Calculated Field…

- Rename the Calculated Field to something meaningful. In this case, the calculated field is named “Sex selector”

- Enter the formula:
CASE [Parameters].[Sex]WHEN 1 THEN [Male]When 2 THEN [Female]END - When finished, Click OK.
Step 3: Add the Calculated Field to the view
- From the Data pane, drag the calculated field to Color on the Marks card.

- Change the colour scheme by clicking the Colour button again and select Edit Colours…

- Select different palletes from the drop-down in the Edit Colours dialog box.
Result
Leave a Reply